 LON-CAPA Help
 LON-CAPA Help
The xtics and ytics tags can be inserted by selecting the Plot tics item from the insert selection list of the gnuplot tag.
The xtics and ytics tags have identical structure and the description presented here applies to both.
The tics tags allow specification of the following attributes:


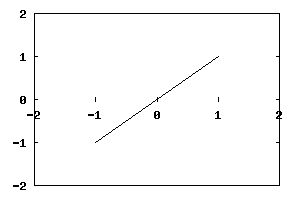
The point in graph coordinates which to start making major tics. This may be less than or greater than the lower limit for the axis.
The span, in graph coordinates, between each major tic mark.
This may be less than or greater than the upper limit for the axis.
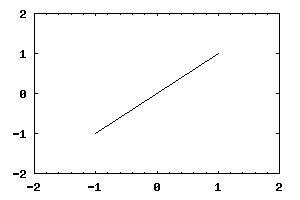
The number of subdivisions to make of the span between major tic marks. Using a value of "10" leads to 9 minor tic marks. The example below uses a value of "5" to produce 4 tic marks.

For output devices that support it, the rotate='1' attribute rotates the tic label. This is most useful with large lables defined by the tic tag described below.
In addition to specifying regular tic intervals via the attributes of the xtics and ytics you can specify arbitrary tic locations by enclosing tic tags within the body of these tags. Each tic tag requires the location attribute which specifies the location of a tic on the axis. The body of the tag contains the label of that tic.
The xtic or ytic rotate attribute can rotate the label text if the output device supports text rotation. If tic tags are embedded within the xtic or ytic tags attributes of those tags that specify tic boundaries and interval are ignored. Here's an example of an X axis tic specification in months of the year:
...
<xtics rotate='on'>
   <tic location='1'>January</tic>
   <tic location='2'>February</tic>
   <tic location='3'>March</tic>
   <tic location='4'>April</tic>
   <tic location='5'>May</tic>
   <tic location='6'>June</tic>
   <tic location='7'>July</tic>
   <tic location='8'>August</tic>
   <tic location='9'>September</tic>
   <tic location='10'>October</tic>
   <tic location='11'>November</tic>
   <tic location='12'>December</tic>
</xtics>
<ytics end="6.0" location="border" start="-6.0"
       increment="1.0" mirror="on" />
Note that tic locations are completely under your control and do not even have to be at regular interevals on the axis if that better suits your needs.