World Charts
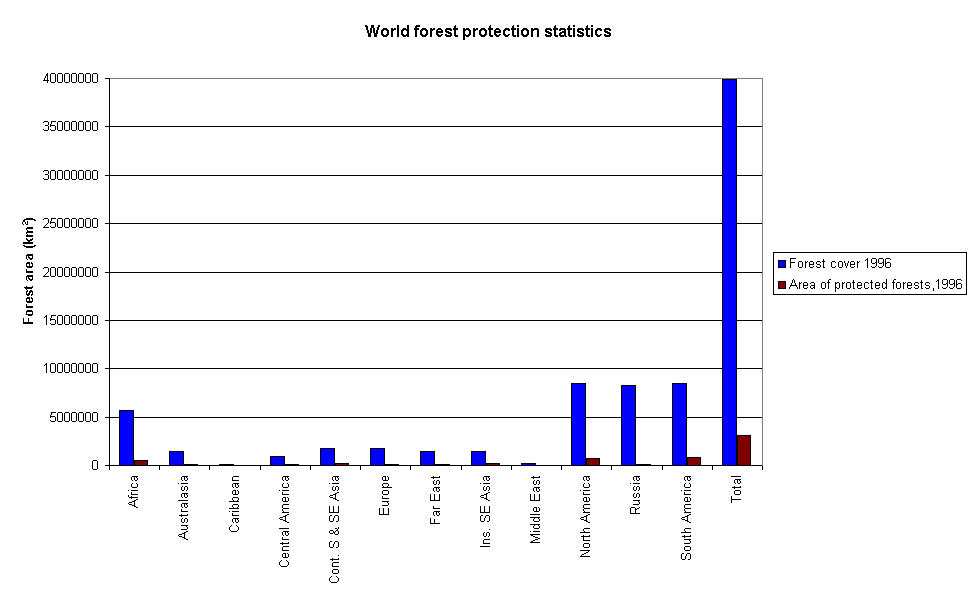
Bar chart showing amount of forest in each region of the globe, with total amount and percentage protected, and including the overall world totals.
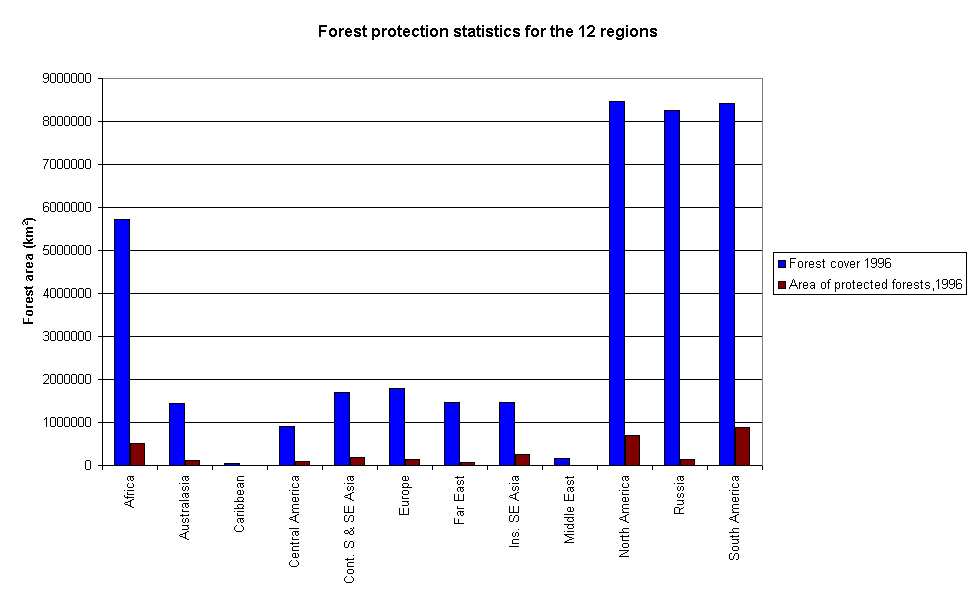
Bar chart showing amount of forest in each region of the globe, with total amount and percentage protected, without the world totals.
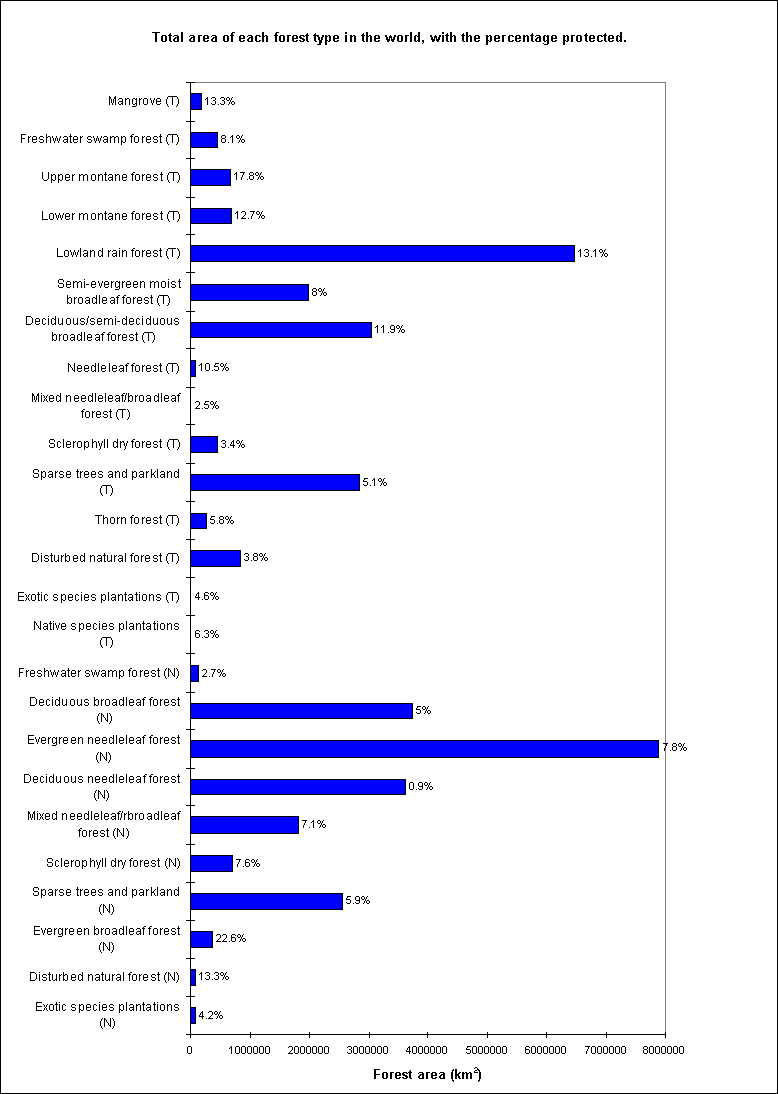
Bar chart showing the amount of each different forest type in the world and percentage protected.
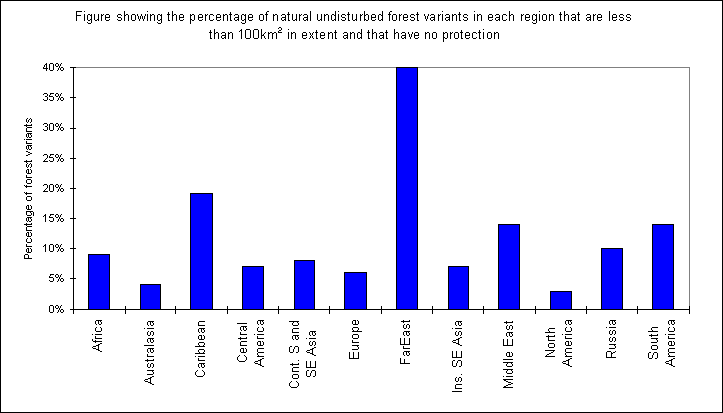
Bar chart showing the percentage of natural undisturbed forest variants in each region that are less than 100km2 in extent and that have no protection.
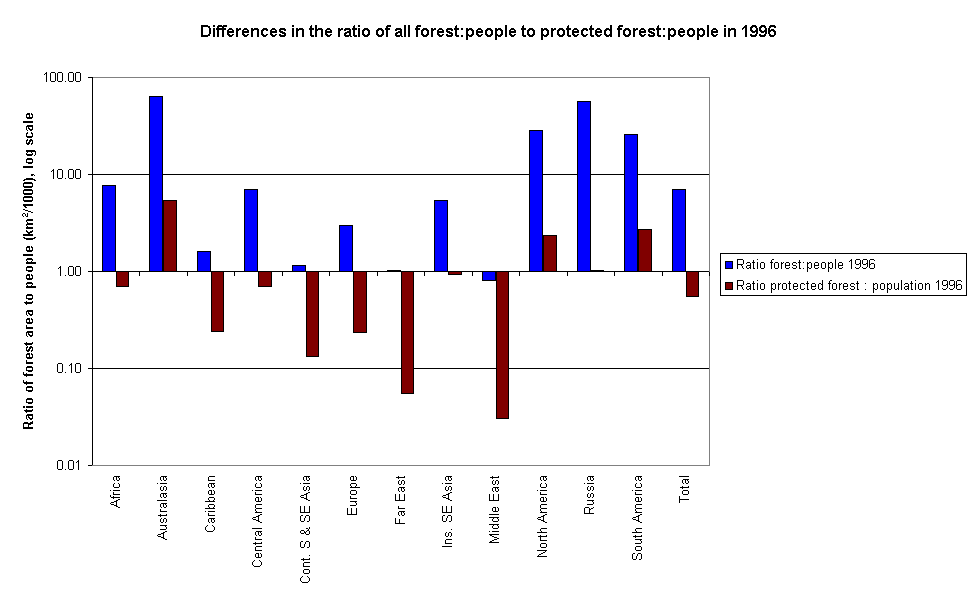
Bar chart showing a comparison of the ratios of forest to protected forest to population in each of the 12 regions of the world (log scale).
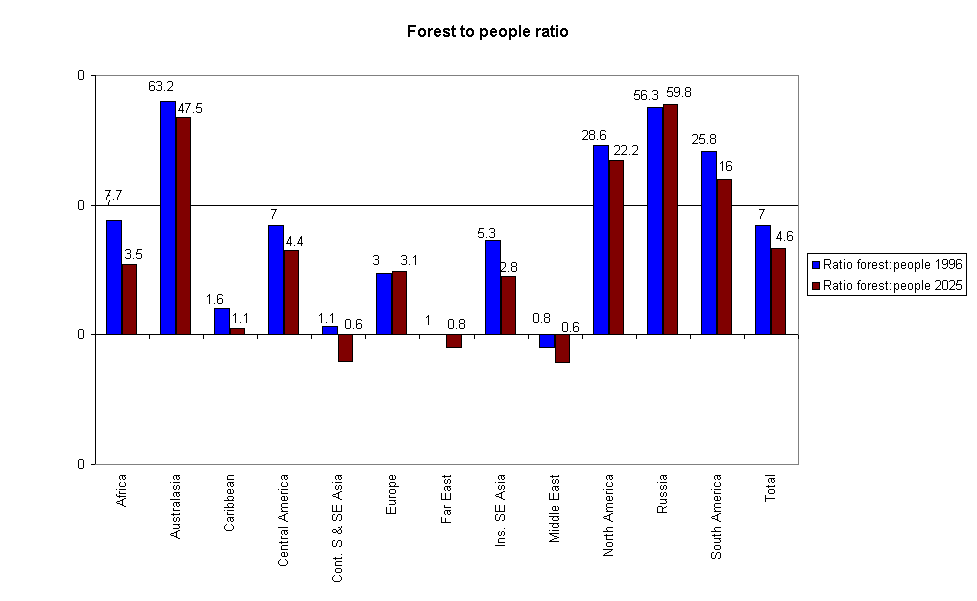
Bar chart showing a comparison of the change in forest to people ratio in 1996 with 2025 (log scale). Exact numbers given above bars for clarity.
 Return to previous page.


 Return to previous page.