South American Charts
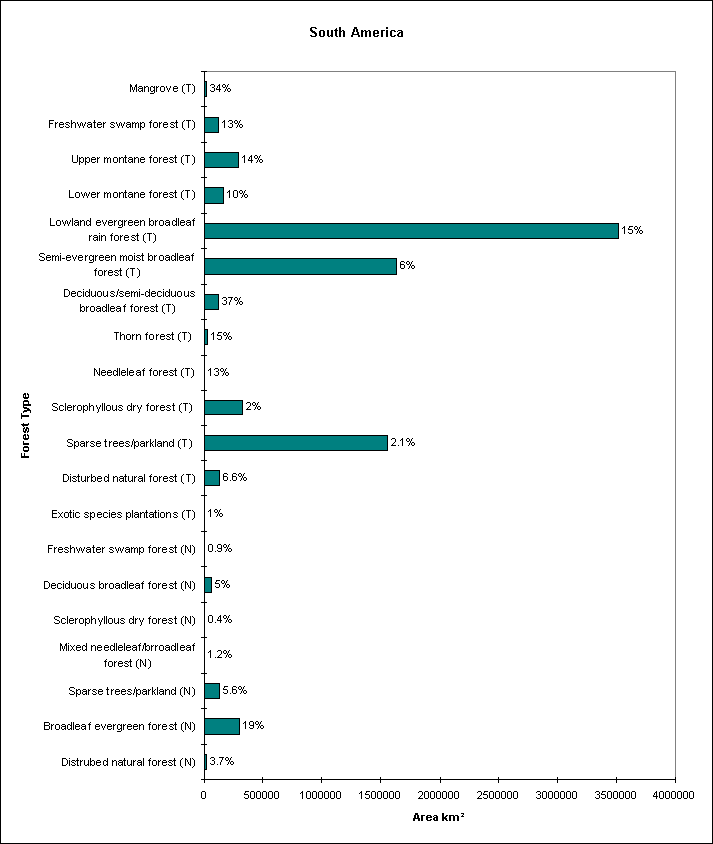
Bar chart showing the total area of each forest type, with the percentage protected written above each bar.

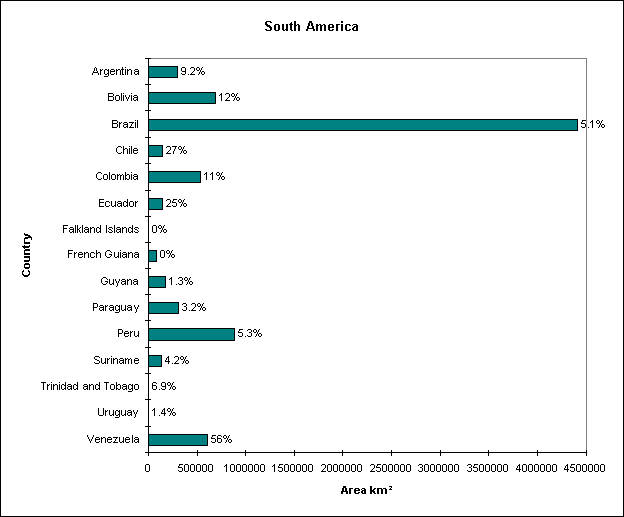
Bar chart showing the total area of forest in each Country, with the percentage protected written above each bar.

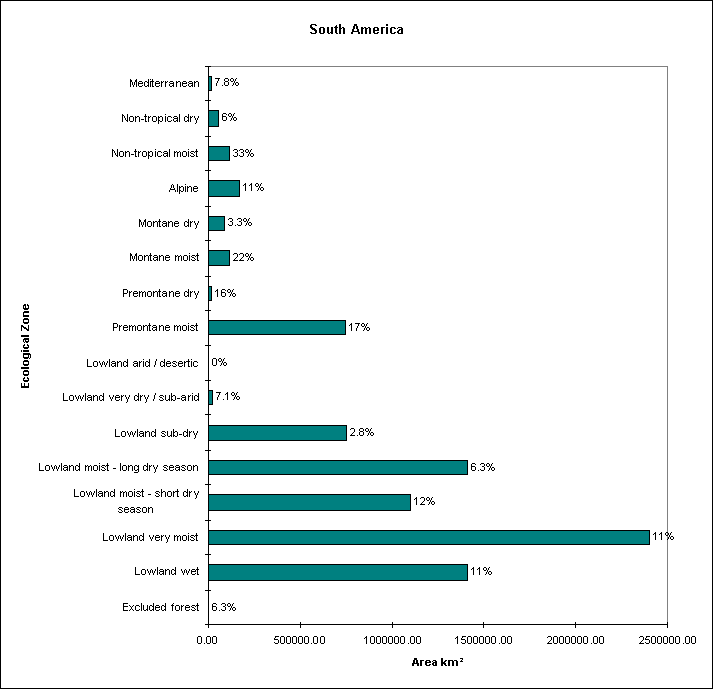
Bar chart showing the total area of forest in each Ecological zone
, with the percentage protected written above each bar.

 Go back to previous page.


 Go back to previous page.