The threshold approach to measuring rarity and narrow endemism has been criticised as essentially arbitrary, because whatever threshold of range size is adopted, it can always miss potentially important species with marginally larger range sizes. An alternative approach is to use measures of range-size rarity that are continuous functions of range size. This escapes the criticism of arbitrariness concerning the precise threshold used to determine which species are included, because all species make a contribution. Instead, rarity is included as a weighting for each species, which is higher for the more restricted species. However, arbitrariness is not avoided, because it remains in the choice of formula for the weighting, for which there is no obvious 'natural' formula.
The examples show several popular measures of range-size rarity applied to published records of British dragonflies among 10 km grid cells (Merritt, R., Moore, N. W. and Eversham, B. C. 1996, Atlas of the dragonflies of Britain and Ireland, HMSO, London.) (range sizes here are measured just within Britain, although global range size could be used). These give increasing weight to the species with the narrowest ranges from left to right (affecting the score-frequency histograms in the upper row), using a difference measure, inverse measure, inverse-square measure, and an inverse-minimum-range measure. Red cells have high rarity scores and blue cells have low rarity scores (in the top row the score classes on the colour scale are arranged for equal intervals of score values, whereas in the lower row they are arranged for equal numbers of grid cells) (below):
 |
Link to image showing continuous measures of rarity using equal interval and equal frequency colour scales. |
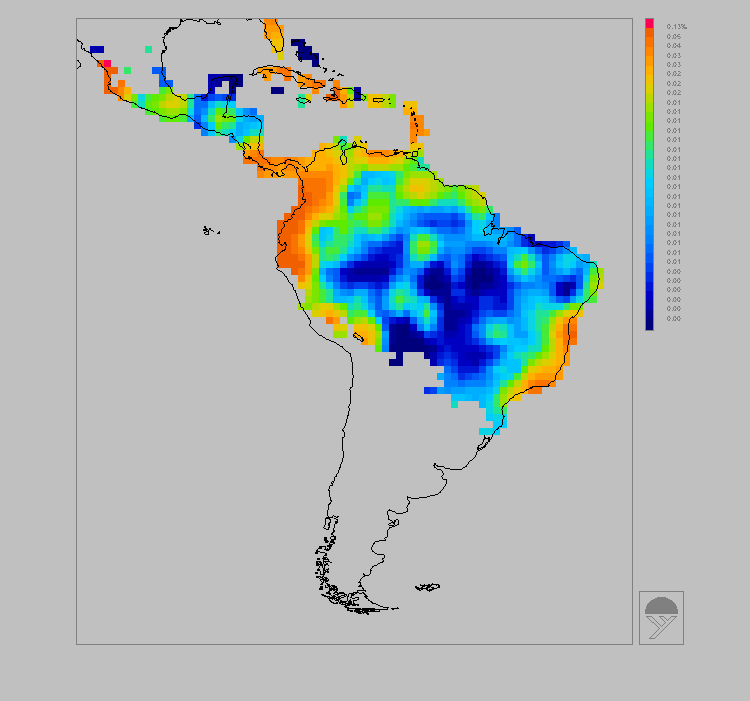
A different example below shows the application of mean rarity from work with the Flora Neotropica data for five plant families (Dichapetalaceae, Lecythidaceae, Caryocaraceae, Chrysobalanaceae and Proteaceae genus Panopsis) among one-degree grid cells, with red for high scores and blue for low scores (the mean rarity scores have been smoothed by neighbourhood averaging) (below):
