Measuring
variation in the strength and breadth of transition zones between biotic
regions
New approaches to measuring spatial turnover
in species among neighbourhoods of adjacent grid cells on maps can be used
to locate many of the boundaries
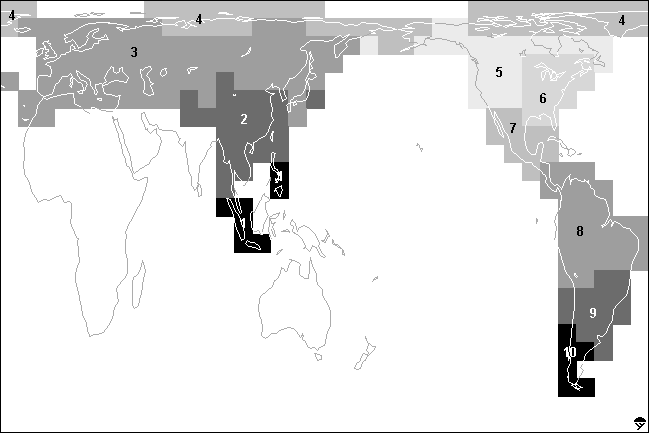
detected by classification (see above) between different faunas. But in
addition, these turnover measures allow exploration of variation
in the strength and breadth of the transition
zones along the biogeographic boundaries (high scores are
not constrained to occur together in lines, and need not completely encircle
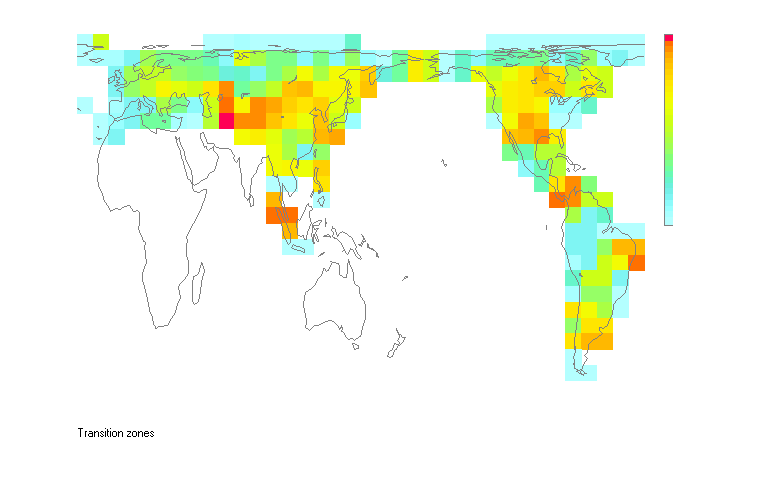
biotic regions). The example shows the application of one of these measures
('beta-3', based on Whittaker's measure of beta diversity) to the same
bumble bee data (ref 9). Orange cells
occur in neighbourhoods of high species turnover (i.e. the transition zones)
and blue cells are in neighbourhoods of low species turnover (below):

Current work is exploring this approach at finer spatial scales and using a broad range of pattern measures. This work relates not only to questions in academic biogeography, but also has potential applications in conservation biology and research into environmental change through changing ecotones.