
Fluorescencein photosynthesis |
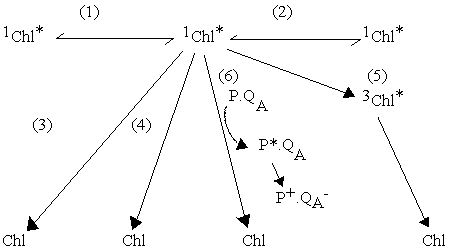
1) Energy transfer to neighboring Chl of the same protein; rate
constant ke1
2) Energy transfer to neighboring Chl of different protein; rate
constant ke2
3) Fluorescence (radiative decay); rate constant kf
4) Non-radiative decay (loss as heat); rate constant kh
5) Formation of triplet state; rate constant kt
6) Energy transfer to an open photochemical trap, and photochemical
conversion; rate constant kp
The open photochemical trap is represented here by P.QA, where P is the primary donor, usually a special chlorophyll or bacteriochlorophyll dimer, and QA is the primary acceptor. In many bacterial reaction centers, and in photosystem II of green plants, QA is a bound quinone; however, in the original nomenclature, Q stood for quencher (of fluorescence, see below).
Fluorescence intensity
FI = ff . I . B
FI is fluorescence intensity, ff is fluorescence yield (see below), I is incident light intensity, B is Einstein coefficient. Product I.B is rate of absorption of light.
Fluorescence yield.
Fluorescence yield is the fraction of the decay that proceeds
through a fluorescence pathway. We can assume that all light harvesting
centers have the same set of decay constants, and that all processes
except photochemical trapping are first order:
ff = kf[Chl*] / (kf[Chl*] + kh[Chl*] + kt[Chl*] + kp[Chl*].[P.QA])
= kf / (kf + kh + kt + kp.[P.QA])
ff = fluorescence yield
[P.QA] = concentration of open traps
kf, kh, kt, kp are rate constants (see scheme above)
Intrinsic fluorescence lifetime
Intrinsic fluorescence lifetime is the lifetime fluorescence would have if there were no other competing processes.
to = 1 / kf or kf = 1 / to
Since probabilities of absorption and emission are related by the factor 8phcn3, to can also be calculated from the absorbance and fluorescence spectra:
1 / to » 2.9 × 10⁻⁹ á n2ñav ò e × dn
Here n is the wavenumber (cm-1) for the transition, á n2ñav is the mean wavenumber of the absortion band (near the center of the band), e is the molar extinction coefficient, and ò e × dn is the area under the absorption band plotted as e vs. n. The shapes of most absorption bands are symetrical, so that ò e × dn is approximately equal to the half-width of the band times the maximal (peak) extinction coefficient, Dn × emax, so to a good approximation:
1 / to » 3 × 10⁻⁹ á n2ñav Dn × emax
Actual fluorescence lifetime
The actual or measured lifetime t, is determined by all the decay pathways:
- d[Chl*] / dt = (kf + kh + kt + kp.[P.QA]) [Chl*]
= k' [Chl*]
ie., k' is the sum of the rate constants for all decay pathways.
By substitution:
ff = kf . t = t / to
and t = ff . to
Closed and open traps, and their fluorescence yield
According to the equations above, the fluorescence expected from a photosynthetic system will reflect the the fraction of open photochemical traps. The inverse relationship implies that fluorescence is lowest when all traps are open, and maximal when all traps are closed. However, any process which directly affects the first-order rate constants for other competing processes will also effect fluorescence. In bacterial reaction centers, the main contribution to changes in fluorecence yield come from changes in the concentration of open traps. However, in green plants, the fluorescence also reflects the the presence of an additional quencher, P+, which effectively dumps the exciton energy as heat by providing an absorption band in the near IR which "absorbs" the fluorescence, and allows it all to decay through non-radiative pathways. Effectively, this allows the non-radiative decay rate constant, kh, to dominate the decay of Chl*, and eliminates the fluorescence.
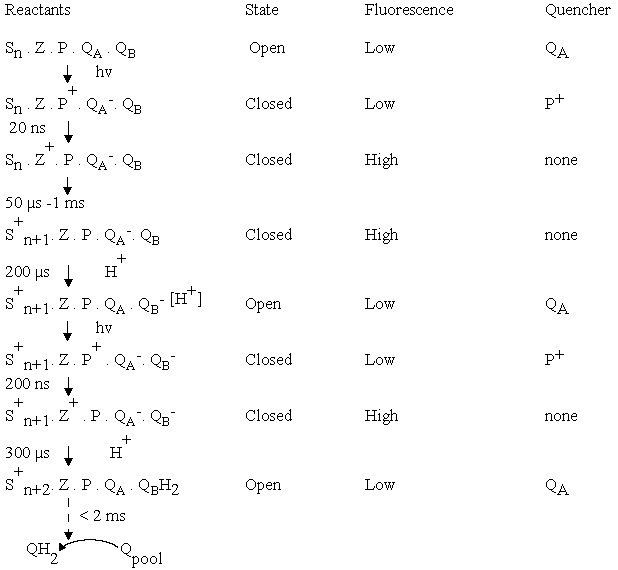
The scheme below summarizes the states of the reaction center
of photosystem II, and the fluorescence levels associated with
them. The transitions from low to high and high to low fluorescence
yield allow the kinetics of the reactions associated with these transitions to be explored through fluorescence, using fluorimeters designed to operate in the µs range. In addition, many other processes giving rise to changes in fluorescence through secondary interactions can be explored through fluorescence. Most important are the processes associated with non-photochemical quenching (qE-quenching), through which plants protect themselves against excess light.
Probability of exciton transfer between centers
If an absorbed photon can be transferred to more than one photochemical trap, the relation between variable fluorescence and [QA-] is not linear. A correction factor can be calculated based on the probability, P, of transfer to another trap. P has a value of about 0.55 in green plants.
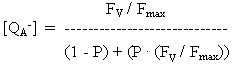
The variable fluorescence Fv is given by Fv = (Ft - Fo) / Fo, where Ft is the measured fluorescence, and Fo is the fluorescence which is not associated with closing of traps (ie., the fluorescence when all traps are open). Fmax is the fluorescence when all traps are closed.