Lecture 23Kinetics and thermodynamics of reaction centers
|
Reaction center of Rhodopseudomonas viridis
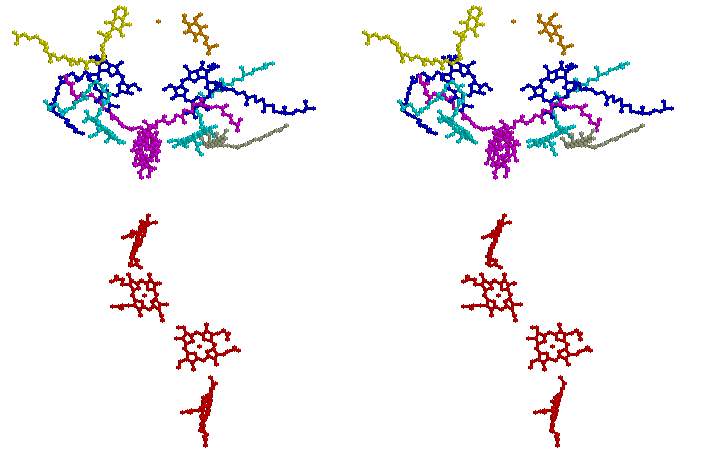
Stereo view of the chromophores of the Rps. viridis reaction center (coordinates from 1prc.pdb, - see Johann Deisenhofer, Robert Huber and Hartmut Michel in Nobel Laureates web-page). Coloring is as follows: cytochrome c hemes, red; special pair (BChl)2, magenta; ancillary BChl, cyan; BPh, blue; QA, yellow; QB, orange; carotenoid, gray. (Rasmol image)
The role of distance in determining electron transfer rates in photochemical reaction centers
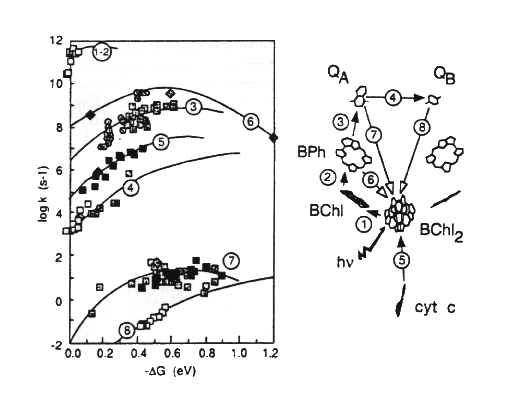
In a previous lecture we looked at the factors determining the value of the rate constant for chemical and biochemical reactions. Research on photochemical reaction centers has been a primary arena for advances in our understanding of the relation between structure and rates of electron transfer in proteins, because the crystallographically defined structures provided for the first time, in the context of an experimental system in which the rates could be accurately measured by picosecond spectroscopy, the spatial parameters and details of reaction medium (the protein) necessary for understanding these processes. A major advance in these studies came from an extensive set of experiments from Dutton's lab (1), in which several different reactions of the photochemical cycle were measured (and rate constants determined), with a variety of molecular engineering tricks to set up a range of values for DGo for the reactions. These made it possible to determine whether the reactions behaved as expected from Marcus theory, (they did), and to derive a general rule (Dutton's Ruler) relating rate of reaction to distance apart of redox centers.
log k = 15 - 0.6R - 3.1(DG + l)2
/ l
where R is the edge-to-edge distance in Angstroms, and DG
and l are expressed in eV, and l is from Marcus theory (see lecture 19).
The following two figures summarize the results of this work:
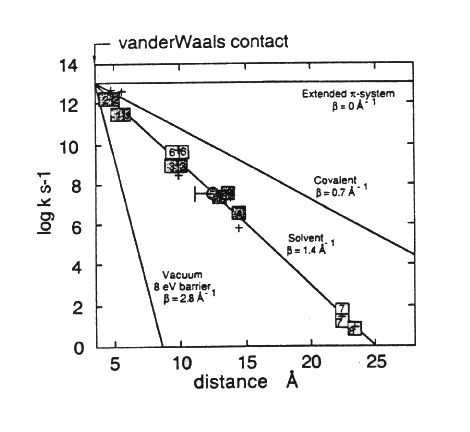
In determining the distances appropriate for electron transfer, Dutton and colleagues used the edge-to-edge distance in Angstroms between the closest points of the conjugate systems of the chromophores.
The positions of the chromophores and distances can be measured from the coordinates using the cursor function in the protein viewer PDVWIN, and are shown below.
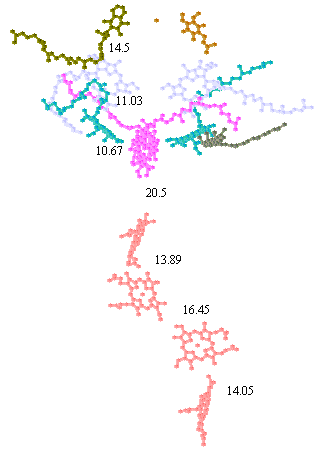
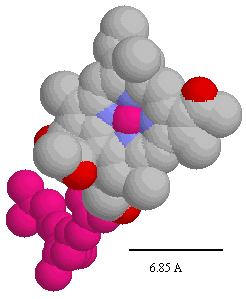 Distances between chromophore centers in Å (left), and spacefilling model of bacteriochlorophyll (note scale,- the heme group has similar dimensions) (right). You can use these figures to get a good idea of the edge-to-edge distances appropriate for application of Dutton's ruler.
Much recent work from other laboratories has confirmed this general picture. In reaction centers from Rb. sphaeroides, site-directed mutagenesis has been used to change the ligands to BChls and BPhs so as to change the free-energy drops in the reaction center, and these mutant strains have been used to extend the range of experiments like those above.
Thermodynamics of photochemical processes
Duysens (2) was the first to consider the limitations of thermodynamic efficiency in photosynthesis. He suggested that the photochemical reactions should be treated as heat engines, where the Carnot efficiency is given by:
E = (Thot - Tcold) / Thot
Here Thot is the "temperature" to which the apparatus is raised by absorption of a photon, and Tcold is the temperature of the environment (~300 K). In determining an approriate value for Thot, Duysens considered the following:
- Photosynthesis occurs most efficiently at light intensities in the range where the rate increases in proportion to intensity.
- Light of energy corresponding the the red absorption bands (~680 nm) was used most efficiently.
- The photosynthetic appartus should, in principle, comes to equilibrium with the light source if there is no flux (wmax or "reversible" conditions).
In view of these factors, Duysens calculated the temperature of a hot body necessary to produce red light at an intensity in the efficient range as ~1100 K, giving an efficiency of ~0.73 (73%).
Much additional discussion of this topic has led to confirmation and an extension of Duysen's early insights, and to a consideration of the optimal power for photosynthetic processes. The Duysen's efficiency represents the maximal work (conditions of zero flux); under normal conditions of flux, some of the work potential is sacrificed to gain throughput. Power is the product of driving force and flux (cf. power in watts = V x A for electrical systems), and the efficiency at maximal power is obtained by maximizing this product. For photosynthetic systems, efficiency at Pmax is ~0.69 for chlorophyll based systems, and ~0.61 for BChl systems. For a review of early work, see (3, 4). For a recent treatment, see (5).
These efficiencies represent the maximal potential for energy conversion under "reversible" and "real" conditions. Of course, photosynthesis under field conditions operates (in terms of yield of biomass) at much lower efficiencies. The conversion of absorbed light to biomass can be as high as 10-15% in an efficient crop plant grown under ideal conditions. The yield in terms of incident light under natural conditions is < 1%.
References
- Moser, C.C., Page, C.C., Farid, R. and Dutton, P.L. (1995) Biological electron transfer. J. Bioenergetics and Biomembranes 27, 263-274.
- Duysens, L.N.M. (1958) The path of light in photosynthesis. Brookhaven Symp. Biol. 11, 18-25.
- Crofts, A. R., Wraight, C. A., and Fleischman, D. E. (1971). Energy Conservation in the Photochemical Reactions of Photosynthesis and its Relation to Delayed Fluorescence. FEBS Lett., 15, 89-100.
- Parson, W.W. (1978) Thermodynamics of the primary reactions of photosynthesis. Photochem. Photobiol. 28, 389-393
- Lavergne, J. and Joliot, P. (1996) Dissipation in bioenergetic transfer chains. Photosynth. Res. 48, 127-138.

©Copyright 1996,
Antony Crofts, University of Illinois at Urbana-Champaign,
a-crofts@uiuc.edu


 Distances between chromophore centers in Å (left), and spacefilling model of bacteriochlorophyll (note scale,- the heme group has similar dimensions) (right). You can use these figures to get a good idea of the edge-to-edge distances appropriate for application of Dutton's ruler.