![]()
![]()
Based on Mader, Sylvia S. 1996. Biology - 5th ed. WCB and Cox, G.W. 1997. Conservation Biology, 2nd ed. WCB.
Reading: Cox pp. 237-242,
Note: These notes are a skeleton, which your instructor will embellish with anecdotes and illustrations, both verbal and visual during lectures. Therefore, reading these notes is not a substitute for coming to class!!!
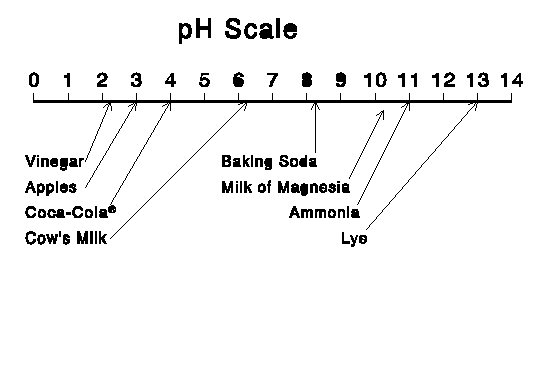
The term pH is a measure of acidity, or the proportion of the Hydrogen ion. Values ca range from 0 to 14, with 7 being "neutral" (hydrogen ions balanced by hydroxyl ions). It is a logarithmic scale; a pH of 5 is 10x as acidic as a pH of 6. Note that the lower the number the more hydrogen ions there are, and hence the more acidity. The opposite of acidity is basicity or alkalinity.
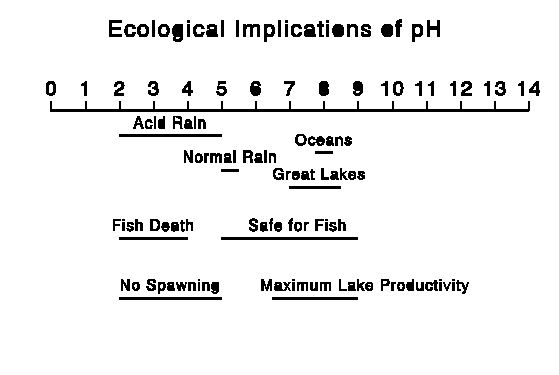
We are concerned here with acidity in the form of acid rain and other acid deposition. Water is normally neutral, with a pH of 7. Normal rain has a pH of 5.0 - 5.6 due to acid formed by CO2 (carbon dioxide) in air. Acid precipitation has a pH less than 5.0. The pH scale and some representative values are shown in the graphics below:


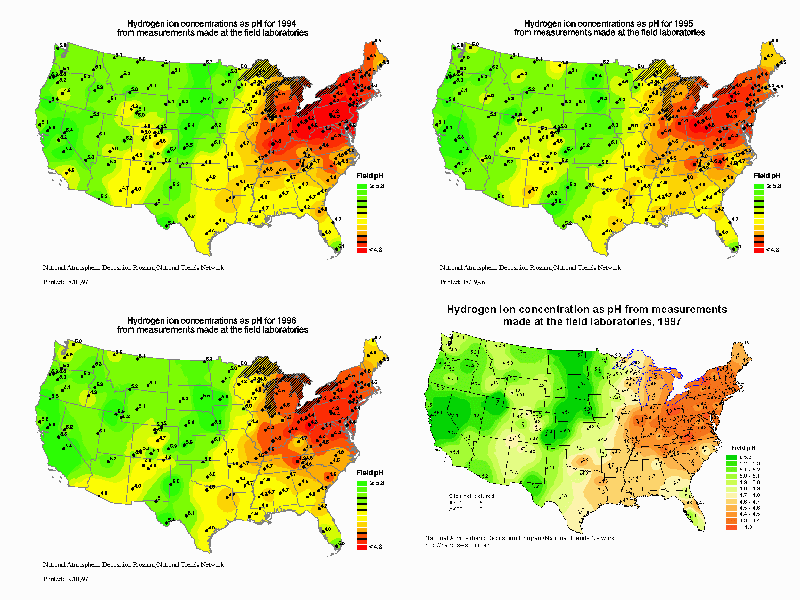
Acid rain is formed when fossil fuels such as coal, oil, and natural gas are burned. It is chiefly the result of sulfur and nitrogen in the exhaust gases. Sulfur is found in the fuels themselves (particularly coal) and forms sulfuric acid in the air. Nitrogen forms nitrogen oxides in internal combustion engines and boilers. Acid deposition is concentrated downwind of areas with large concentrations of power plants.

Note: Right-click on the maps above to get a better view.
These sources put considerable acids into the air as well.
Forest decline has been seen in many parts of the world. It is manifested by increased mortality and reduced growth in the forest. It has been particularly well-studied in the eastern US and western Europe. It was first noted in Germany in the 1960's; 35% of Europe was affected by 1988. In Czechoslovakia, 71% of forests are affected; in Germany, 52% of the forests are affected. Acid rain caused billions of dollars of damage in Europe in 1990 alone. The greatest effects are seen downwind from polluting regions, and where soil has no buffering capability.
damage due to acid deposition probably linked to other stresses
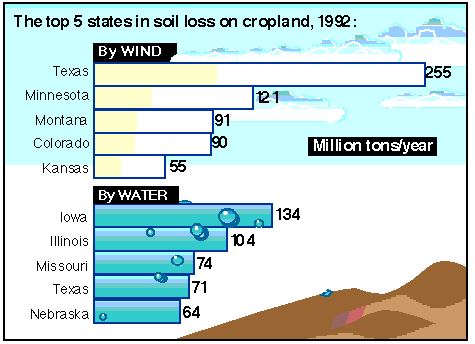
Soil erosion is the largest single source of water pollution in the US. It occurs around construction sites, roadways, farm fields, etc. I don't have much to say on the topic; but here are some links so you can go and learn a bit on your own:

National Resources Inventory - Takes a while to load, but has great graphics (like the picture above) and lots of info on land use and soil erosion.
Land Use Bibliography - Papers dealing with land use issues, agriculture, soil erosion, etc.
Sustainable Agriculture - This issue is an important part of the soil erosion picture.
Journal of Soil and Water Conservation - This journal is starting to put its table of contents and some papers on-line.
Wetlands Health - A short paper describing how we determine coastal marsh health. Jumping the gun a bit, as we will talk about wetlands later.
National Soil Data Access Facility - Hard-core, technical soil data is available here. A good resource for a project working on soils.
National land use and soil erosion maps - More USDA data - great sources.
![]()
![]()
Environmental Biology Top Page
About Sequences
About Ecosystems
![]()
Return to McShaffrey Home Page
![]()