2. How do eukaryotes differ from
bacteria with respect to the following:
(a) size
of RNA polymerase?
__________________________
(b) rate of DNA
replication? ___________________________
(c)
frequency of introns?
____________________________
(d) coupling of
transcription/translation? _________________
(e)
organization of genes into operons? ___________________
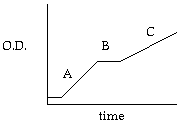
Bonus Question: A cell mutates so that the gene coding for adenyl cyclase (the enzyme that converts ATP into cyclic AMP) is lost. Draw a graph similar to the figure in question 1 above that would accurately predict how this cell would behave in a medium containing both glucose and lactose.