Area-selection methods are sets of rules designed to achieve particular goals efficiently and with a transparency that aids accountability. Other properties are also important, including the ability to promote flexibility for the planning process; speed to facilitate the exploration of alternative values, goals, data and flexible solutions; ability to deal with incomplete data; and simplicity to aid communication. Accountability is important to the people giving conservationists their mandates so that they can see that their values are being acted upon and that limited resources are not being misused (ref 8, ref 5). This aspect will become increasingly important as litigation obliges conservationists to defend area choices. Efficiency is important because the area of land available for conservation is usually limited because there is usually competition between conservation and incompatible land uses for managing particular areas. Efficiency should always be considered in relation to the goal of ensuring viability and persistence to ensure that effective choices are made.
Quantitative methods can be applied to measures of biodiversity value, including phylogenetic diversity, species, higher taxa, vegetation or land classes, or most of the other biodiversity surrogates. The general form required of the data is of an areas by attributes (biodiversity-surrogates) matrix. The general form of the priority problem is one of seeking the maximum representation of the chosen biodiversity surrogates (often species) within the areas selected, either to achieve at least one, or multiple representations within the selected areas set (ref 8). Therefore the rarity and narrow endemism of these surrogates are also important factors.
Frequently asked questions are of the form 'which is the minimum set of areas within Madagascar required to represent all species of lemurs?' This expresses a simple goal of complete representation, often in the first instance seeking representation of each species in at least one area (ref 5, ref 8). There are many pitfalls with this approach, not only concerning the problems of viability and threat, but also concerning the meaning of 'complete'. It is obvious that a single representation of a species will not represent all of the intraspecific variation. The problem becomes worse with remote surrogates for biodiversity value, for example a single representation of every vegetation class from a vegetation classification is unlikely to represent every species, let alone all of the intraspecific variation. The only reliable solution to representing every difference is to include every area, although the premise of area-selection methods is that competition with incompatible land uses limits the area available for conservation (conflict resolution). However, if the fundamental value is cumulative richness in different genes or characters (biodiversity value), then minimum-area sets for surrogates at least have the distinct advantage that they can be expected to improve in terms of this currency against undirected selections for the same number of areas.
In practice, it may often be more appropriate to pursue goals for maximising biodiversity representation as a maximal-covering set of areas. This approach addresses frequently asked questions such as 'how can we choose 1% of the total area of Madagascar to represent the greatest number of lemur species?' The principle has long been recognised in approximate techniques for selecting ordered area sequences, for example in prioritising areas by taxonomic diversity (ref 1, ref 11).
A popular approach for selecting priority areas for the conservation of biodiversity has been to select hotspots of diversity. Hotspots is a term often associated with Norman Myers' pioneering world-wide review of regions combining high richness, narrow endemism and threat. Subsequently, others have considered hotspots in a narrower sense of high scores for species richness within continents or countries (ref 8). With appropriate qualification, hotspots can be used for high-scoring areas on any value scale and on any spatial scale. For example, the consequences might be considered of choosing the top 5% of areas (10km grid cells) within Britain by species richness as conservation areas. This method has the appeal of dealing with species-occurrence data with apparent quantitative rigour. It also has the advantage that knowledge of the identity of each species is not required, so it would be possible to use extrapolated richness scores.
Hotspots of rarity or narrow endemism are similar to hotspots of richness, but concentrate on more narrowly distributed species. For example, areas with high richness in just those species with range sizes of less than 50,000 km² (discontinuous measures) have been considered as priorities for future protection. This has the advantage of requiring data for only the more restricted species. Furthermore, because the species are necessarily narrowly distributed, it is also likely to select for more highly complementary biotas and so lead to more complete representation of species. A refinement of this technique is to map a continuous function of range size, such as summing the inverse of species range sizes.
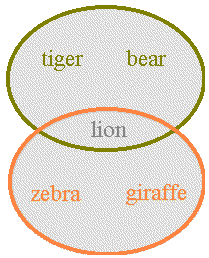
Where identities of species or of other surrogates for biodiversity are known, complementarity methods can be applied. These methods are used to seek areas that in combination have the highest representation of diversity. Complementarity refers to the degree to which one or more sets of attributes contributes otherwise unrepresented attributes to one or more other sets of attributes (ref 1). For example, if one area has a fauna consisting of a tiger, bear and lion, while another area has a fauna with a lion, zebra and giraffe, then the second area's fauna complements the first by the zebra and giraffe (below):

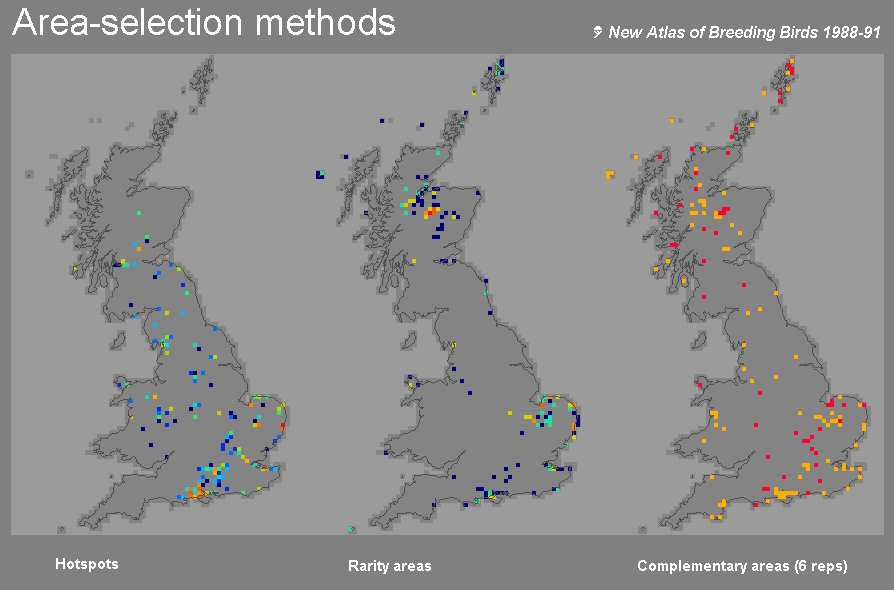
Complementary areas are more efficient than hotspots of either richness or rarity. A joint study with the British Trust for Ornithology of data for British breeding birds sought a goal of representing as many species as possible within 5% of the 10 km grid cells within Britain (ref 8) (below):

While the hotspots of richness and rarity failed to represent all species
at least once, the complementary areas represented all of the species at
least six times over (or included all representatives for the more narrowly
distributed species) within the 5% area limit. Inevitably, hotspots of
richness did give the highest total number of species-in-gridcell records,
but most of these were repeat representations of more widespread species.
In comparison, rarity and complementary areas showed a more even representation
among species, although the complementary areas increased the number of
representations for many of the rarer species in particular relative to
the others (ref 8).
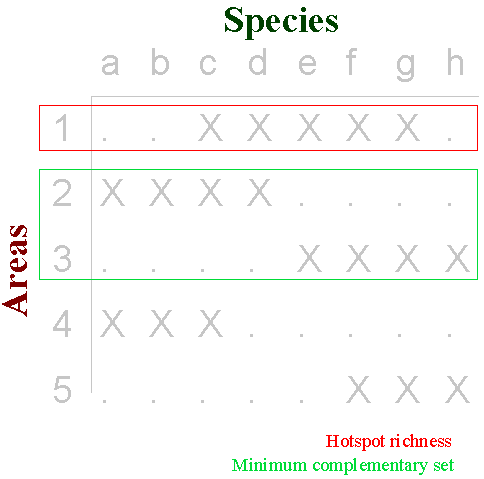
Complementarity can be used to find efficient solutions to area-selection problems. In the simple example of a species by areas data matrix below (adapted from the work of Les Underhill), it is obvious that areas 2 + 3 complement one another perfectly to represent all species a-h between them. In this particular case the hotspot of greatest species richness, area 1, is not needed for a minimum set of complementary representative areas (2 + 3). Areas not needed to attain a particular representation goal may often be identified by including redundancy tests within area-selection procedures (below):

Unfortunately, not all data sets are so straightforward. There is in fact no fast and general solution to the problem (an 'n-p complete' problem) and the popularity that has come from the efficiency of complementarity has brought a tremendous proliferation of techniques. One comparative study of many different complementarity-based area-selection techniques was applied to data for vertebrates, in collaboration with the Oregon Gap Analysis project (ref 11). The results illustrate some of the major features of the different groups of algorithms. Exact solutions can be achieved by exhaustive searches of all possible sets, although these are too numerous to be practical for problems with all but very small numbers of areas. Techniques such as branch-and-bound algorithms can give optimal solutions, but even they can take hours or days to provide results when dealing with just a few hundred species and areas, which renders inter-active assessment of priority areas out of the question (ref 8). Consequently, faster but approximate techniques (heuristic algorithms) based on measures of rarity are often employed as an alternative. The practical advantage of speed from heuristic techniques has come to be appreciated (just as in systematics, where comparable optimisation problems occur). Furthermore, the reduction in the efficiency of rarity heuristics that results from incorporating redundancy checks is usually small.
The table below shows an example of a near-minimum-area set to represent
all of the bumble bees of the sibiricus-group. The table lists the
areas in the order (step) in which they have been chosen, together with
the five rules used to choose them (ref
13) (below):
Area choices:
| step | chosen area | rule used |
| 1 | Kashmir | (irreplaceable species) |
| 2 | Afganistan | (irreplaceable species) |
| 3 | Ecuador | 2: rarest + next rarest |
| 4 | Michoacan | 5: rarest + next rarest + next rarest + next rarest + lowest cell |
| 5 | Qinghai | 5: rarest + (no next rarest) + lowest cell |
| 6 | NE India | 5: rarest + (no next rarest) + lowest cell |
| 7 | C Bolivia | 1: rarest |
| 8 | N California | 3: rarest + next rarest + next rarest |
| 9 | Uzbekistan | 5: rarest + (no next rarest) + lowest cell |
| 10 | Turkey | 5: rarest + next rarest + next rarest + next rarest + lowest cell |
| 11 | Irkutsk | 2: rarest + next rarest |
| 12 | Big Horn | 5: rarest + (no next rarest) + lowest cell |