![]()
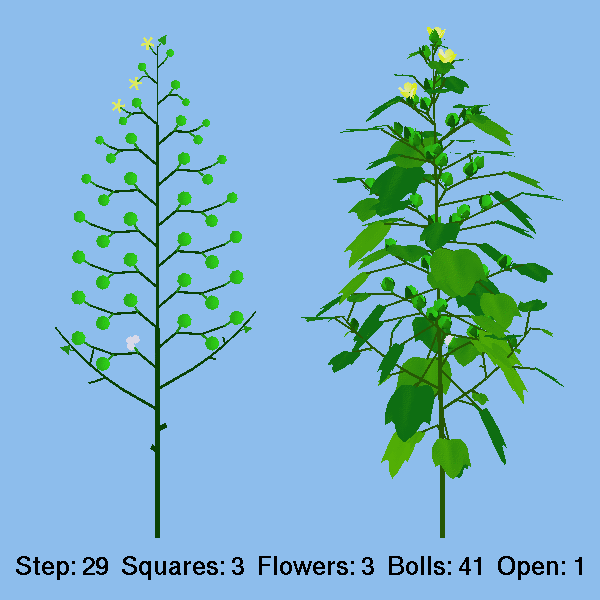
It is sometimes more useful to show the output of virtual cotton simulations as schematic diagrams (left), similar to plant maps, rather than as realistic images (right) in which some plant parts obscure others from view. The information generated by a virtual cotton simulation can also be output as numbers which can be analysed using conventional statistics.

![]()
Last updated: Jim Hanan, 8 January 1997