Lecture 25
Oxygen evolution
|

Overall reaction for oxygen evolution
Oxygen evolution catalyzed by photosystem II has the following overall
reaction:
2H2O + 2PQ + 4HN+ <=> O2
+ 2PQH2 + 4HP+
The partial reactions are as follows:
Donor side:
2H2O + 4P+680 <=> O2
+ 4P680 + 4HP+
Acceptor side:
2 x ( PQ + 2HN+ + 2QA-
<=> PQH2 + 2QA )
Photochemical reaction:
4 x ( P680QA + hn
<=> P+680QA- )
Mechanism of oxygen evolution.
From the reaction formula above, it is clear that oxidation of water to
O2 requires abstraction of 4 electrons. Since the photochemistry
is a 1 photon/1 electron event (Einstein's Law), this requires a mechanistic
interface between the 1-electron photochemistry, and the 4-electron oxidation
process.
The first clear indication of the underlying mechanism came from
experiments of Pierre Joliot using a new design of O2-electrode,
in which the Pt-electrode had a large surface area. When chloroplasts or
algae were applied to this electrode in a thin layer, and illuminated with
a continuous light, the response time was fast enough to measure the rate
accurately, together with induction effects. If the preparation was dark
adapted for ~10 min before illumination, the O2-evolution showed
a lag, which was not apparent if the dark period was short. Further investigation
showed that preillumination with short flashes produced marked variation
in the initial rate seen on subsequent steady-state illumination, with
a maximal rate when the sample was preilluminated by two flashes. In later
experiments, and in collaboration with Bessel Kok, a useful property of
the Joliot-electrode was exploited,- because of the large surface area,
the electrode consumed O2. When the preparation was excited
by ~10ms flashes from a xenon flash apparatus,
a transient current flowed in the detection circuit as O2 was
produced following the flash, and then consumed by the electrode (see insert
in Fig. below). The yield of oxygen from the flash could then be measured
(given approximately by the area under the transient). When the flash yield
of O2-yield was plotted as a function of flash number, the pattern
seen in the Fig. below was seen.
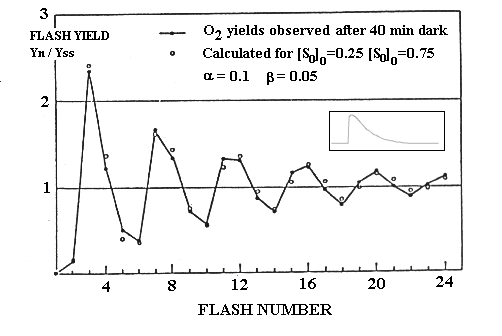
Flash yield of O2 as a function of flash number. The experimental
results are fitted by a model based on Kok's scheme, with a
and b parameters for misses and double hits
as indicated, to account for the damping observed. The initial distribution
of S-states was assumed to be 25% S0, 75% S1 (see
below for explanation).
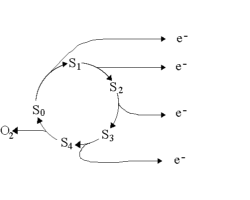 Kok's clock scheme to explain the pattern of oxygen flash
yield.
Kok noted that the pattern showed:
-
No O2-evolution on the first flash, very little (0.2 x x YSS)
after the second, a maximal yield (2.5 x YSS) after the third,
and a substantial yield (1.3 x YSS) after the fourth (YSS
is the flash yield in the steady-state). In similar experiments using shorter
laser flashes (20 ns) it has been shown that no O2 is evolved
on the second flash.
-
A maximum in O2-evolution every fourth flash after the third.
-
A damping of the amplitude of the oscillation.
To account for these observations, he postulated that the O2-evolving
apparatus could exist in 5 states, number S0 - S4.
For states S0 - S3, a single photochemical event
could drive the transition from one state to the next, by oxidation through
generation of P+.
Sn...P+ ==> S+n+1...P
The state S4 was assumed to be unstable, and to spontaneously
decay to S0 with evolution of oxygen.
In order to account for the maximal yield on the third flash, Kok suggested
that the S1 state was major stable in the dark. To explain the
yield on the fourth flash, he proposed that the S0 state was
also stable in the dark.
The ratio of yields on the third and fourth falshes showed that
about 25% of the centers had S0, and 75% S1 in the
dark. The explanation for this distribution came from studies of the relaxation
of the S-states, along the lines of the experiment in the Fig. below.
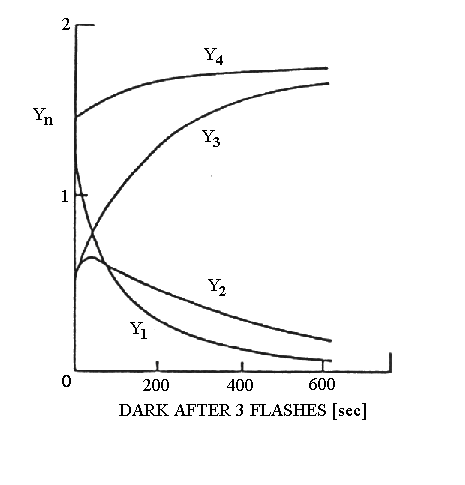 Algae were dark adapted for 20 min, then illuminated with 3 flashes
closely spaced (<1s). After a variable dark time, a group of 4 closely
spaced flashes flashes was given, and the yield of O2 from each
flash was recorded. The experiment was repeated with different dark times,
and the yield for each flash plotted as a function of dark time. The curves
indicate the evolution of the S-state system after the preilluminating
flash group.
In the experiment shown, the population immediately after the third
preilluminating flash was about 30% S3 (from Y1),
40% S0 (from Y4), and 15% S1 and S2
(from Y3 and Y2), from the curves at short dark times.
The decay of the Y1 curve reflects the loss of S3
as it decays to S1 via S2, etc. Analysis of the curves
from this and similar experiments, in which the yield was tested with the
dark time after 1 or 2 preilluminating flashes, allowed deconvolution of
the relaxation kinetics of the different S-states.
The conclusion from such experiments was that S3 decays to
S1 via S2, but that S1 and S0
are stable once formed. In the steady state, the yield on each flash is
the same, indicating that S0, S1, S2 and
S3 are at the same concentration, each accounting for 25% of
centers. The decays then give 75% S1 (from 25% each of S1,
S2, and S3 in the steady state), and 25% S0
as the distribution after relaxation in the dark for ~20 min.
H+-release during water oxidation.
Four protons are released for each O2 in water oxidation. The
pattern of water release does not follow the O2 evolution pattern.
At neutral pH, the pattern is 1:0:1:2 for transitions S0 ®
S1 ® S2 ® S3 ® S0. At lower
pH, the pattern changes to 1:1:1:1, presumably reflecting a pK on a protein
side chain involved in proton release.
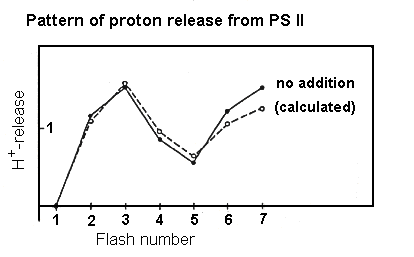 Pattern of H+-release during water oxidation as a function
of flash number. Centers were preilluminated by 1 flash and dark adapted
so that most centers were in the S1 state before the flash sequence.
Calculated values reflect a and b
parameters similar to those for the O2-evolution pattern.
Mechanism of proton release
The mechanism of proton release is intimately tied to the mechanism of O2-evolution. The two schemes below are taken from:
Schlodder, E. and Witt, H.T. (1999) Stoichiometry of Proton Release from the Catalytic Center in Photosynthetic Water Oxidation. J. Biol. Chem. 274, 30387–30392.
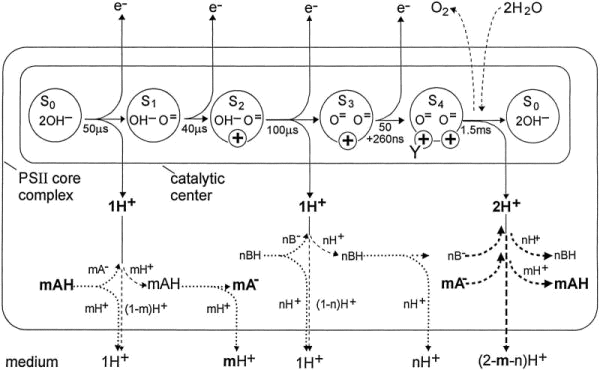
SCHEME 1. Pathway of the protons from the CC and core complex into the medium. Top, pH-independent pattern of net charges (circled plus signs) and proton releases from the CC. Possible water derivatives in the S states are indicated. Center, pH-dependent course of proton release from amino acid residues of the PS II core complex and its interaction with the net charge in the CC. The H+ release from the CC should be as fast as the indicated times of the S state transitions (34, 35) (solid lines). However, the kinetics might be faster if mH+ is released from mAH (pK ~5.7) by a pK shift through the charge of the transiently oxidized YZ (dotted lines). Such fast H+ releases have been measured by Junge and co-workers in Refs. 13 and 14 (see the introduction). When YZox is reduced by oxidizing S0, the shift is reversed and mA- traps mH+ from the proton released from the CC. This results in an apparent biphasic H+ release (dashed and dotted lines). mAH can be deprotonated again by YZox formation preceding S1 ® S2. However, this mH+ release is not reversed, because the created net charge of S2 keeps the pK shift and mA- stable when YZox
is reduced by oxidizing S1. (It is assumed that the interaction of the charge of YZox with the acids is practically the same as that of the net charge in the CC.) Thus the net charge is lastly responsible for a stable electrostatic mH+ release into the medium. For completeness, the response of an acid group nBH with a high pK value (e.g. pK ~ 11) is noted. nBH may be deprotonatable between pH 5 and 7 only by interaction with two charges.
This is realized when the net charges in S2 and S3 are accompanied by the charge of the transiently oxidized YZ. The course of the released protons would correspond in S2 ® S3 and S3 ® S4 to that outlined for mAH in S0 ® S1 and S1 ® S2, respectively. The double net charge in S4 would keep nB- stable. When in S4 ® S0 the net charges disappear with the 2 H+
release from the CC, mA- and nB- are reprotonated by uptake of (m + n)H+ (thick dotted lines). According to the results of this work, only the presence of the amino acid group mAH (pK ~ 5.7) is necessary to explain the observed pattern of H+ release into the medium.
Bottom, overall proton release into the medium.
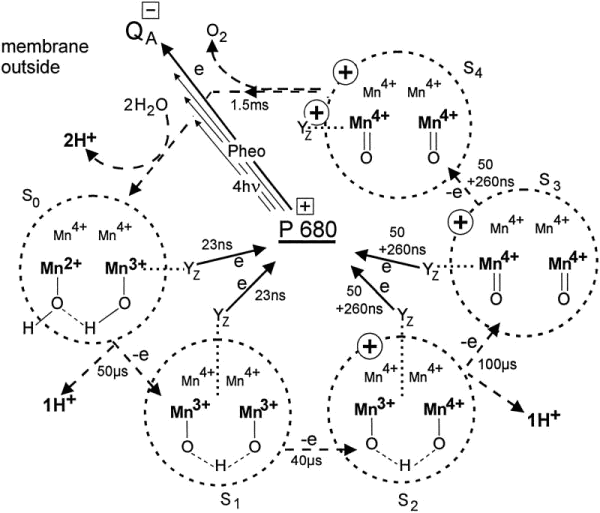
SCHEME 2. Model of the period four oscillation of manganese oxidation, net charge formation, and water de-protonation. The S state cycle S0 ® S4 is driven by quaternary, light-induced transmembrane electron transfers from P680 to QA. P680+ oxidizes step by step via tyrosine YZ, a manganese dimer up to S3. The oxidized YZ has been hypothesized in Ref. 35 to be the fourth oxidizing equivalent in S4 that triggers the electron transfer from the two oxo-atoms to the four oxidizing equivalents by its electric field. For clarity the charges of the water derivatives (Scheme 1) have been omitted.
Direct measurement of the electron transfer kinetics of the S-state transitions.
Bruno Velthuys showed that the redox reactions of the S-state transitions
were accompanied by absorbance changes in the near UV. Unfortunately, this
region of the spectrum has flash-induced absorbance changes from several
processes, but the contibutions of the S-states can be deconvoluted by
suitable choice of wavelength, experimental conditions, and modelling the
period 4 oscillation pattern. In the experiment below, the traces on the
left show the absorbance changes measured at 290 nm when the overall reaction
is uninhibited; the traces in the middle show the data under conditions
in which the O2-evolution was inhibited, and the S-state changes
eliminated, by removal of the Mn-cluster (by hydroxylamine treatment),
leaving changes due mainly to the acceptor side semiquinones; the traces
on the right show the difference, and reflect predominantly the changes
due to S-state transitions.
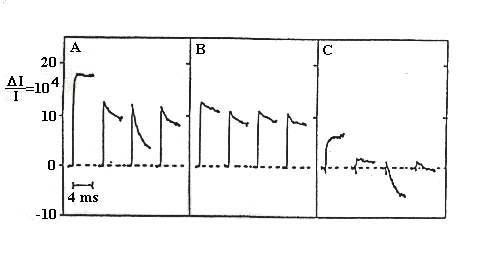 Absorbance changes measured at 290 nm on flash illumination with
a group of 4 flashes from the dark adapted state.
Left, no additions; center, same after hydroxylamine treatment (showing
acceptor side changes); right, difference ± hydroxylamine (showing
donor-side changes).
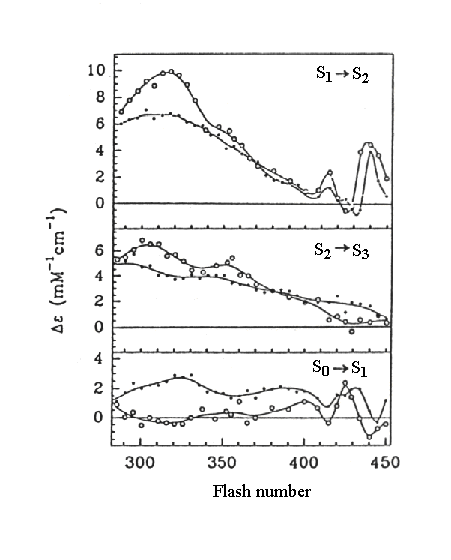 Spectra of absorbance changes attributed to the S-state transitions
indicated (results from two different labs are shown). The contributions
from changes due to formation or loss of semiquinones on the acceptor side
(QA- and QB-, with a peak at
320 nm, and tyrosine oxidation, with a peak at 260 nm), have been subtracted.
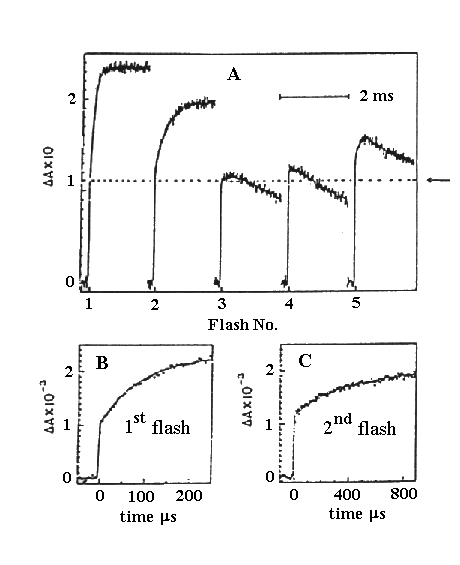 Experiments similar to those above, showing resolution of the kinetics
of the transitions for S1 ® S2 and S2
® S3.
EPR spectra of the S-states
Charles Dismukes showed that the S2-state has a characteristic
multiline EPR spectrum. Under conditions in which the S-state transitions
are block by Ca2+ or Cl- depletion, the S2-state
loses the multiline signal, and instead shows a signal centered at g=4.1.
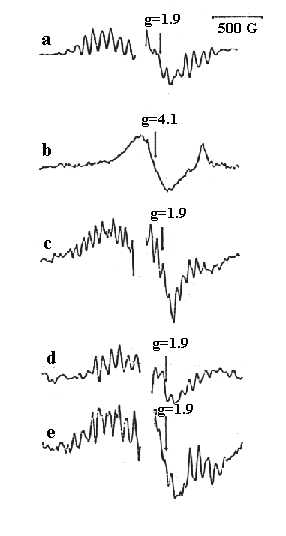
Much work has gone into characterisation of the S2-state
signals, because they contain information about the coordination of the
Mn, especially when the spectroscopy is extended by use of ENDOR or ESEEM
protocols. Similar multiline signals are shown by synthetic Mn-clusters,
and much effort has been invested in comparative spectroscopy to identify
in model systems the pattern of lines, and higher order structure, seen
in photosystem II in the S2-state.
The geometry of the Mn-cluster from X-ray spectroscopy
X-ray K-edge absorption (XANES).
The outer shell electron orbitals of atoms are important in absorption
of X-rays. Metals show well defined absorption bands for the K-shell, with
characteristic energies for the different metals. The structure and redox
state of the Mn-cluster have been investigated through K-edge absorption
sprctroscopy. The energy at which absorption occurs is modified by the
redox state on model compounds, and this has been used to investigate the
changes in redox state of the Mn-cluster accompanying the S-state transitions.
The traces below show the K-edge absorbancies for the different S-states.
The second derivative of the spectrum brings out the fine structure in
the absoption profile (the null-points close to the vertical broken line
correspond to maximal rates-of-change of absorption with energy increase,
or the inflexion point).
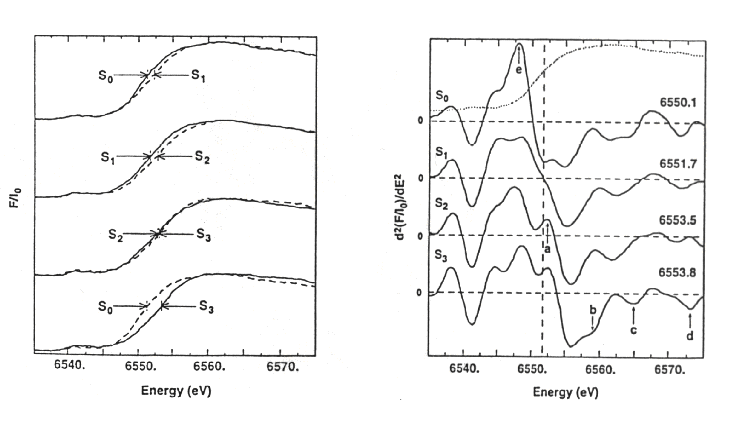
-
Left: The K-edge absorption spectra for photosystem II in different S-states.
-
Right: The second derivatives of the traces on the left. The correspondence
between the two representations can be seen when both are plotted, as in
the top right.
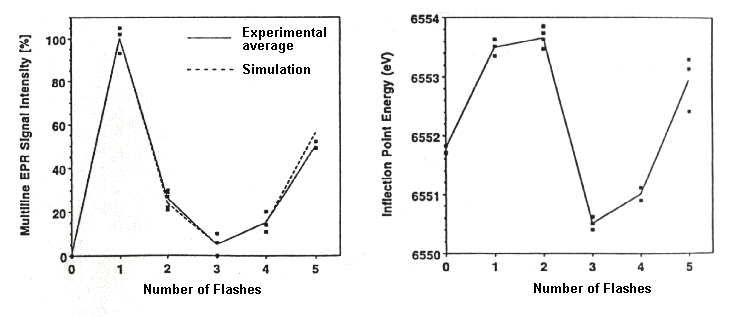
-
Left: The amplitude of the S2-state multiline EPR-spectrum plotted
as a function of flash-number to show the progression of the S-state transitions
(remember that the starting state is S1 at zero flashes).
-
Right: The position of the K-edge from the same preparation to show the
corresponding S-state.
Reference:
Roeofs, T.A., Liang, W., Latimer, M.J., Cinco, R., Rompel, A., Andrews,
J.C., Yachandra, V.K., Sauer, K. and Klein, M.P. (1995) Manganese oxidation
states on the flash-induced S-states of photosystem II. In "Photosynthesis:
from Light to Biosphere", ed. by Mathis, P., Vol II, pp. 459-462. Kluwer
Academic Publ. Dordrecht.
Note that there is an obvious shift in the K-edge for transitions S0
® S1, S1 ® S2, and (in the reverse direction)
for S3 ® S0, but the S2 ® S3
transition shows no obvious shift. This has been taken to showed that the
S-state transitions involve a change in redox state of the Mn atoms in
all except the S2 ® S3 transition. The likely changes
are from MnII to MnIII, or MnIII to MnIV.
Most authors favor the later for most transitions; S0 is either
II, III, IV2 or III2, IV2.
EXAFS - Extended X-ray absorbance fine structure.
The EXAFS region is the fine structure after the K-edge. When the primary
absorber (the Mn in this case) absorbs X-ray photons, the excited state
decays by emmission of fluorescence. The fluorescence photons collide with
neighboring atoms, and are back-scattered. The fine structure in the absorbtion
spectrum is due to the interference from these back-scattered photons.
The pattern of the fine structure reflects the number and mass of the atoms,
and ther distance, and the spectrum can be analyzed theoretically to reveal
this information, by Fourier transformation.
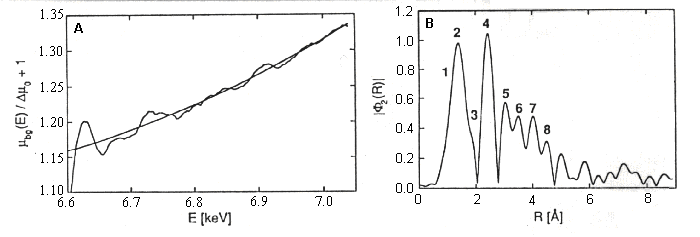 Left: The EXAFS region of the spectrum, with a theoretical line showing
the spectrum expected of there is no backscattering.
Right: The Fourier transformed data showing the amplitudes and distances
of the scattering atoms in the neightborhood.
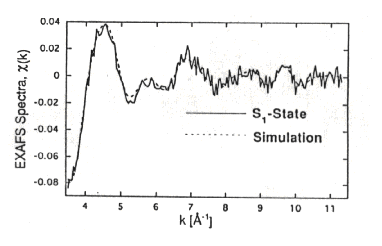
-
Below: The EXAFS region after subtraction of the theoretical line.
-
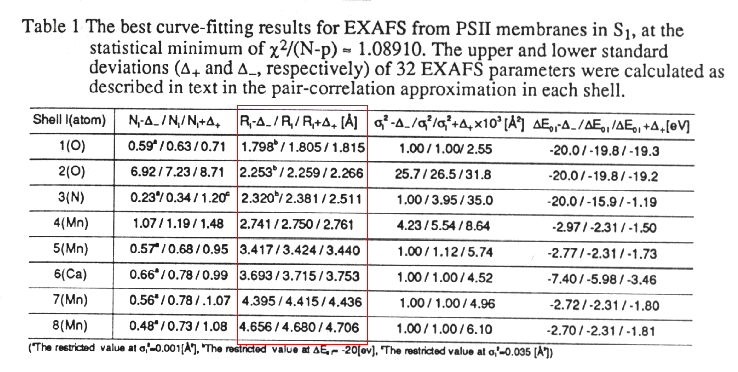
The Table below shows the parameters used to generate the fitted curve
drawn through the data. The red framed data set shows the distances of
atoms of the type indicated in the left-hand column of the table.
 Interpretation
Five different models consistent with EXAFS data, with different configurations
of basic dimer of m-dioxo bridged dimers. Working
model used is that shown below, but others fit S-state EPR data better.
No change in EXAFS spectrum for S1 ® S2, so only change is in MnIII
® MnIV.
S2 structure is modified by NH3, with O-distance
change from 2.7 to(two peaks 2.8 + 2.9
S2 ® S3 also has change in second Fourier peak,
but to 2.85. Maybe made up of two peaks, 2.82 and 2.96
S0 ® S1 also has similar distance change, but
in opposite direction.
Interpreted as showing that S1 has two 2.7 distances and
one or both of these change in transitions S2 ® S3,
to 2.82 and 2.96, and back again on S0 ® S1.
S0 Mn-Mn distances indicate protonation of oxo-bridges.
Reference
Kusunoki, M., Takano, T., Ono, T., Noguchi, T., Yamaguchi, Y., Oyanagi,
H. and Inoue, Y. (1995) Advanced EXAFS studies of the S1-state
Mn-cluster in plant photosystem II. In "Photosynthesis: from Light to Biosphere",
ed. by Mathis, P., Vol II, pp. 251-254. Kluwer Academic Publ. Dordrecht.
Models of the 4Mn-center
A consensus over the past few years has favored models of the Mn-cluster
like that below. Two pairs of Mn atoms are joined by two oxygen atoms in
di-µ-oxo bridges. They are held together by a fifth oxygen, and the
structure is held in place by ligands from the protein. These are represented
by carboxylate groups (labelled D, E for the single-letter-code for aspartate
and glutamate), and histine (see previous lecture
for discussion of the structure on the donor side of photosystem II). The
distal Mn atoms of each pair are available for binding water, which is
the substrate for the formation of oxygen.
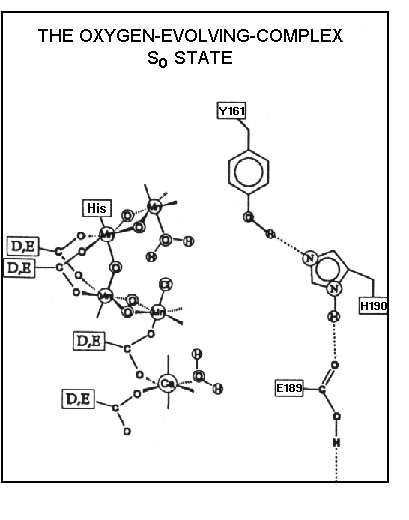
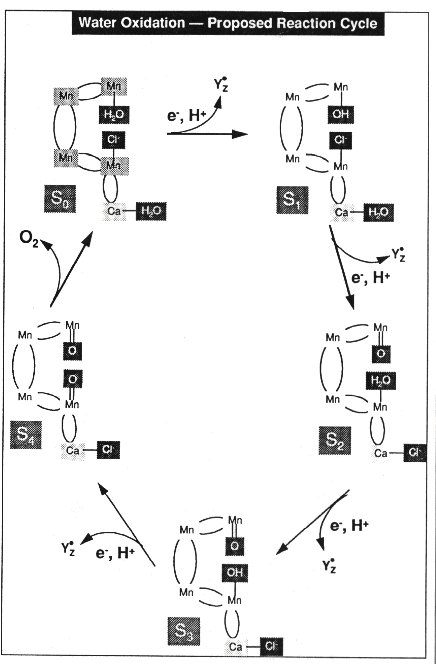
Model for the mechanism of water oxidation
Gerry Babcock has proposed the model below, which accounts for much of
the data discussed above. Babcock suggests that the tyrosine-161 of D1
(YZ), which acts as the donor to P+680,
undergoes reaction effectively as a H-carrying redox center. On oxidation
by P+680, an electron is lost from the tyrosine,
and a proton is released, which is transferred to the exterior (lumenal
aqueous phase) through a H+-channel (see Lecture
12, shown in the scheme above as consisting of His-190 and Glu-189).
The tyrosine radical then abstracts an electron and a H+ from
water molecules bound to the Mn-complex in four successive steps, corresponding
to the S-state transitions. The liganded oxidation products are neutral,
and redistribution of electrons in the complex allows the redox changes
to occur at the Mn atoms.
 Reference
- Babcock, G.T. (1995) The oxygen-evolving complex in photosystem
II as a metallo-radical enzyme. In "Photosynthesis: from Light to Biosphere",
ed. by Mathis, P., Vol II, pp. 209-215. Kluwer Academic Publ. Dordrecht.
- Hoganson, C. W., and Babcock, G. T. (1997) Science 277, 1953–1956

©Copyright 1996, Antony
Crofts, University of Illinois at Urbana-Champaign,
a-crofts@uiuc.edu


